Networks on Maps (with Python)

The available data on country attributes is permanently growing and their access is getting more and more comfortable, e.g. in the case of a direct API for (nearly) all the world bank data. Many of those characteristics are genuin network relations between countries (like trade flows), thus, in the sense of Social Network Analysis (SNA) edges between nodes. However, it is still a challenge to visualize those international relationships, though there exist many programs that cope with that issue (e.g. Gephi).
Nevertheless, I would like to illustrate in this brief note the specific possibilities of combining the Networkx and Basemap package in Python, since it provides a „whole-in-one“ solution, from creating network graphs over calculating various measures to neat visualizations.
The matplotlib basemap toolkit is a library for plotting data on maps; Networkx is a comprehensive package for studying complex networks. Obviously, the relations between nations can be best represented if their network locations are equal to their real world geographic locations, to support the readers intuition about borders, allies and distances. That´s precisely the point here, additional enhancemenents will follow (e.g. how to calculate and visualize certain measures).

After you imported both packages (together with matplotlib) in your Python environment, we are ready to go.

from mpl_toolkits.basemap import Basemap
import matplotlib.pyplot as plt
import networkx as nx

First of all, we need to set up a world map style that will serve as background, but there are also many regional maps available, depending on what you want to show.


m = Basemap(projection='robin',lon_0=0,resolution='l')

In this case, I chose the classical „Robinson Projection“ (the other two arguments define the center of the map and the graphical resolution).
After the set up we can now ‚draw‘ on the map, e.g. borders, continents and coastlines, like in geography lessons.


m.drawcountries(linewidth = 0.5)
m.fillcontinents(color='white',lake_color='white')
m.drawcoastlines(linewidth=0.5)

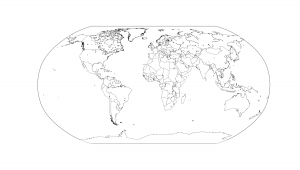
Now you will get something like this:

Map1

To be sure, you can change the color and width of the lines, continents, seas and rivers with the subsequent arguments in each function. Letting rivers and lakes disappear is a bit more tricky, cf this issue stackoverflow.

Once our background is established, we can start and draw the positions of the countries. First, we need to define their position in respect of longitude and latitude, e.g. in terms of their geographical centre (click here for the coordinates):

# load geographic coordinate system for countries
import csv
country = [row[0].strip() for row in csv.reader(open(path + '\\LonLat.csv'), delimiter=';')]    # clear spaces
lat = [float(row[1]) for row in csv.reader(open(path + '\\LonLat.csv'), delimiter=';')]
lon = [float(row[2]) for row in csv.reader(open(path + '\\LonLat.csv'), delimiter=';')]
# define position in basemap
position = {}
for i in range(0, len(country)):
position[country[i]] = m(lon[i], lat[i]) 

Now Networkx comes into play. With ‚position‘ we can define the ‚pos‘-argument of the nx.draw-function, thus that we can match the coordinates of each coutnry with any Networkx graph where the names of the nodes are countries. To match similar one´s more easily (and saving you tons of time cleaning your data), use this nice little function:

def similar(landstring, country):
 l = difflib.get_close_matches(landstring, country, 1)
 return l[0]

Then we are ready to connect our network with the position via (here are the data of our example graph):

pos = dict((land, position[similar(land)]) for land in G.nodes())

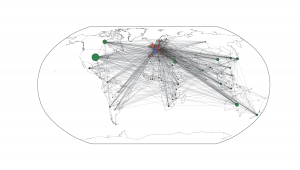
Almost done. The last step is to define your network attributes you like to visualize in your graph. In our case, the connections between the countries represent international scientific collaboration in Economics and their subsequent communities (variable ‚part‘) according to the modularity algorithm.

nx.draw_networkx_nodes(G, pos, nodelist = [key for key in part if part[key] == 0],
 node_size = [deg_weight[s]*10 for s in part if part[s] == 0],
 node_color = 'red', node_shape='^', alpha=0.8)
 nx.draw_networkx_nodes(G, pos, nodelist = [key for key in part if part[key] == 1],
 node_size = [deg_weight[s]*20 for s in part if part[s] == 1],
 node_color = 'black', node_shape='d')
 nx.draw_networkx_nodes(G, pos, nodelist = [key for key in part if part[key] == 2],
 node_size = [deg_weight[s]*10 for s in part if part[s] == 2],
 node_color = 'green', node_shape='o')
 nx.draw_networkx_nodes(G, pos, nodelist = [key for key in part if part[key] == 3],
 node_size = [deg_weight[s]*10 for s in part if part[s] == 3],
 node_color = 'blue', alpha=0.8)
 nx.draw_networkx_edges(G, pos, color='grey', width = 0.75, alpha=0.2)
 plt.show()

Map2

You see the effect of the different arguments in the draw_networkx_nodes/edges command in terms of node color, size or shape. That´s where you modify your graph.
In our example you realize at a glance that there a historically and politically rooted collaboration preferences in the economic field, with a bipolar Europe, a rather peripher community of Third World countries and a dominating global group arranged around the US. Due to the basemap background and the geographic coordinates of the nodes, this relationships are immediately and intuitively apparent.
Thinking outside the rectangle

The following should not be considered a full fledged argument but rather as general musings on a certain approach to data and its asociated problems.

When social scientists hear the word „data“, chances are they picture it as a rectangle. We are used to thinking about data as datasets, dataframes or more generally as tables made up of rows (observations) and columns (variables). This is how it is normally taught to students and how most of us work with data professionally. Consequently, we spend many hours on preparing the right rectangle for a given problem. Transforming, maintaining and analyzing data is done mostly in the logic of the dataframe.

This approach to data has its merrits. First of all, it is easy to comprehend and understand since most people are familiar with this kind of data structure. It is also easy to use when writing syntax as most statistic programmes are build around the notion of a rectangular dataset. Secondly, the dataframe fits our methodology. Almost all of our methods are defined by statistical operations which are performed on observations and variables or both. Finally, rectangular or flat data sets are also somewhat of a common ground in social science. They allow for discussion, criticism and exchange of datasets between researchers.

That being said, there are some limitations inherent in a strictly „rectangular“ approach to data. While we should by no means abbandon the dataframe, it pays to see more clearly, what we can and cannot do with it.

What is your rectangle made of?

Most of the common statistic programmes and languages provide the user with a flat data structure. Even so these structures look alike, they can be very different in terms of their actual implementation. Take for example the R data.frame objects and the DataFrame provided py pandas. They have a very similar functionality and feel but are implemented quite differently (since they are from two different languages, this is to be expected). R’s data.frame builds around the native datastructures of vectors and list while pandas is more of a wrapper around NumPy arrays who offers additional methods and more user-friendliness. This is neither the space, nor the right author to give a full account of all the differences between those two. Yet, something that many people who made the transition seem to struggle with is the more functional style of R versus the more object oriented of pandas. Even so the data structure seems to be the same (after all pandas is explicitly modeled after R’s data.frame), the ways of handling problems are not.

The problem I want to point out is this: Because we are used to the look and feel of it, we tend to ignore the actual differences between specific implementations. Although, this sounds rather trivial I do believe it to be the most problematic aspect of strict adherence to the „rectangle paradigm“. By treating data structures as if they were the same, we are essentially ignoring the possibility that there could be a better tool for the job than the one we are currently using. It also obscures the inner workings behind the data structures, which becomes a big problem as soon as you are trying to implement your own stuff or are switching from one framework to another.

How big can a rectangle get?

While rectangular data sets are functional and easy to use, they are not the most memory efficient structures. Arrays and matrices are faster in most cases, which is why most statistic frameworks convert the data to those formats before doing the actual analysis. Yet the real problem is more one of bad practice. „Big Data“ may be all the rage right now, in the social sciences it seems to be mostly a problem of data being not really too „big“ but rather too „large“ for a specific framework and the machine on which it is running. In most cases there is no real need for better algorithms or parallel computing. Part of the problem is keeping the entire data set in memory while in most cases only a fraction of it is actually used.

In my experience, a average data set in the social sciences has roughly 10 000 to 20 000 observations and around 5 000 variables. In principle this is manageable but can become tricky when it comes to transforming or reshaping the data in fundamental ways. Again, this depends heavily on the actual statistic software used for the task and reinforces what was said about knowing the actual implementation. Yet the problem becomes more pronounced when many data sets are combined as is common in cross-country research.

However, in most cases we only need a fraction of the original data. More specifically, 10 to 20 variables are on average enough. And those are in general not the problematic ones. We seldom need those pesky memory-eating string variables anyway. So the solution would be to keep the data as a whole in a data base and use a specialized language like SQL to construct your dataframe. The resulting data structure is not only smaller, but has the advantage of requiring much less memory intensive transformations. Yet this kind of workflow is strangely absent from most curricula I know. What is even more problematic is the insistence of many big surveys to deliver their data in some well known formats like sps, dta, csv and so on. While this is intended to be helpful, it has the side effect of reinforcing the idea that one rectangle fits all.

New possibilities, old rectangles?

The rectangle paradigm is also challenged by new formats and new possibilities of data acquisition. More and more data is directly available through APIs or as a result of data and text mining techniques. In both cases the resulting data seldom comes in the form of a nicely labeled dataframe. Those new data sources are often created by other disciplines, most notably computer scentists and programmers, consequently they are not specifically tailored to the needs and wants of social scientists. So we are often stuck waiting for someone to bridge the gap and provide us with our familiar, rectangular dataframe. Of course this means passing on good opportunities for interesting analyses.

So it seems to make sense to at least broaden our horizon and find a more comprehensive view on data. As said before, there are good reasons to stick to the good old rectangle, but there should be at least some awareness of other options.